Metro Vancouver Bus Performance Analysis
data
map
R
transit
Analysis of scheduled bus speeds with respect to stop spacing
Introduction
One of the keys to enabling a competitive public transit system is speed, and consequently, travel time. Slower speeds may be a symptom of unpredictable service, eroding confidence and pushing people towards alternative modes which save travel time albeit with potentially higher costs.1 Additionally, a transportation option that does not value people’s time deters potential riders away from ever considering it. To achieve ambitious transit modal share targets where the majority of people choose public transportation over personal vehicles, public transit needs to be appealing to those who have the option to drive. In other words, transit travel time needs to be comparable to, or less than, that of driving. This is particularly true for mixed-traffic transit, which has to share its route with other road users.
Within Metro Vancouver, buses serve as the main form of mixed-traffic transit and are mostly divided into three types: standard buses, RapidBuses, and the 99 B-Line. The purpose of this investigation was to find and compare the scheduled speed of these three bus types. An overall trend of stop spacing was identified to explain why bus speeds vary between routes and potential outliers were investigated. To provide some context, comparisons were made to see how Metro Vancouver stacks up against domestic and international counterparts. Finally, a discussion was had about how standard buses can attain better performance through infrastructure and policy restructuring.
Background and Methodology
TransLink is the transportation authority that manages the bus network in Metro Vancouver, through their subsidiary, Coast Mountain Bus Company. The buses primarily fall into the three aforementioned categories of standard buses, RapidBuses, and the 99 B-Line. Other niche types such as highway express and community shuttle routes are grouped into the standard bus category for this analysis.
Bus Types
Standard buses comprise the majority of bus routes in the region and they typically have little infrastructure besides sign poles and possibly a bench at each stop.
RapidBuses are express buses with additional features such as all-day frequency (usually every 15 minutes or better), wider distances between stops, all-door boarding, and real-time displays at bus stops.2 RapidBus routes also feature a mix of bus priority measures (e.g., bus lanes, queue jumps, HOV lanes) for approximately 1/3 of their route.3
Lastly, the 99 B-Line is another express bus route with frequent service and transit priority by means of bus lanes. It serves as both the progenitor for the current RapidBus routes as well as the last surviving example of the B-Line express buses.
Both the RapidBus and the 99 B-Line are characterized as “BRT-lite” routes, having some transit priority measures associated with Bus Rapid Transit, but lacking others, including signal priority and continuous dedicated bus lanes.
Data Sources
The data that was examined for this analysis consisted of the 36 busiest bus routes in Metro Vancouver according to annual boardings in 2022, as found in the Transit Service Performance Review (TSPR) for that year.4 This includes the 99 B-Line, all 5 RapidBus routes, and 30 standard bus routes to provide a decent sample size. For each route, one direction of travel was chosen for inspection, that being the direction TransLink labels as “1”. The scheduled running time, the time it takes to travel from one terminus to another, was collected for both the AM and PM peak periods (around 8 AM and 5 PM) using bus schedules issued in 2023 September.5 Distances were obtained from the 2022 TSPR Bus/SeaBus Summaries6 and validated using Google Maps for accuracy. If there was a large discrepancy of a few kilometres or more, the Google Maps measurement was preferred. Then, average scheduled speeds were calculated using the simple equation relating speed, distance, and time. Finally, the number of bus stops on a particular route was manually tallied from the bus schedules.
It should be noted that while bus schedules account for traffic, but it is certainly not guaranteed that a bus adheres to the schedule. Alternatively, buses may arrive on time, but be at full capacity, thus being incapable of taking on more passengers. While TransLink does release on-time performance metrics, these are not specific to the peak periods, when transit ridership and general traffic is usually at their highest.
Results and Discussion
Standalone Speeds
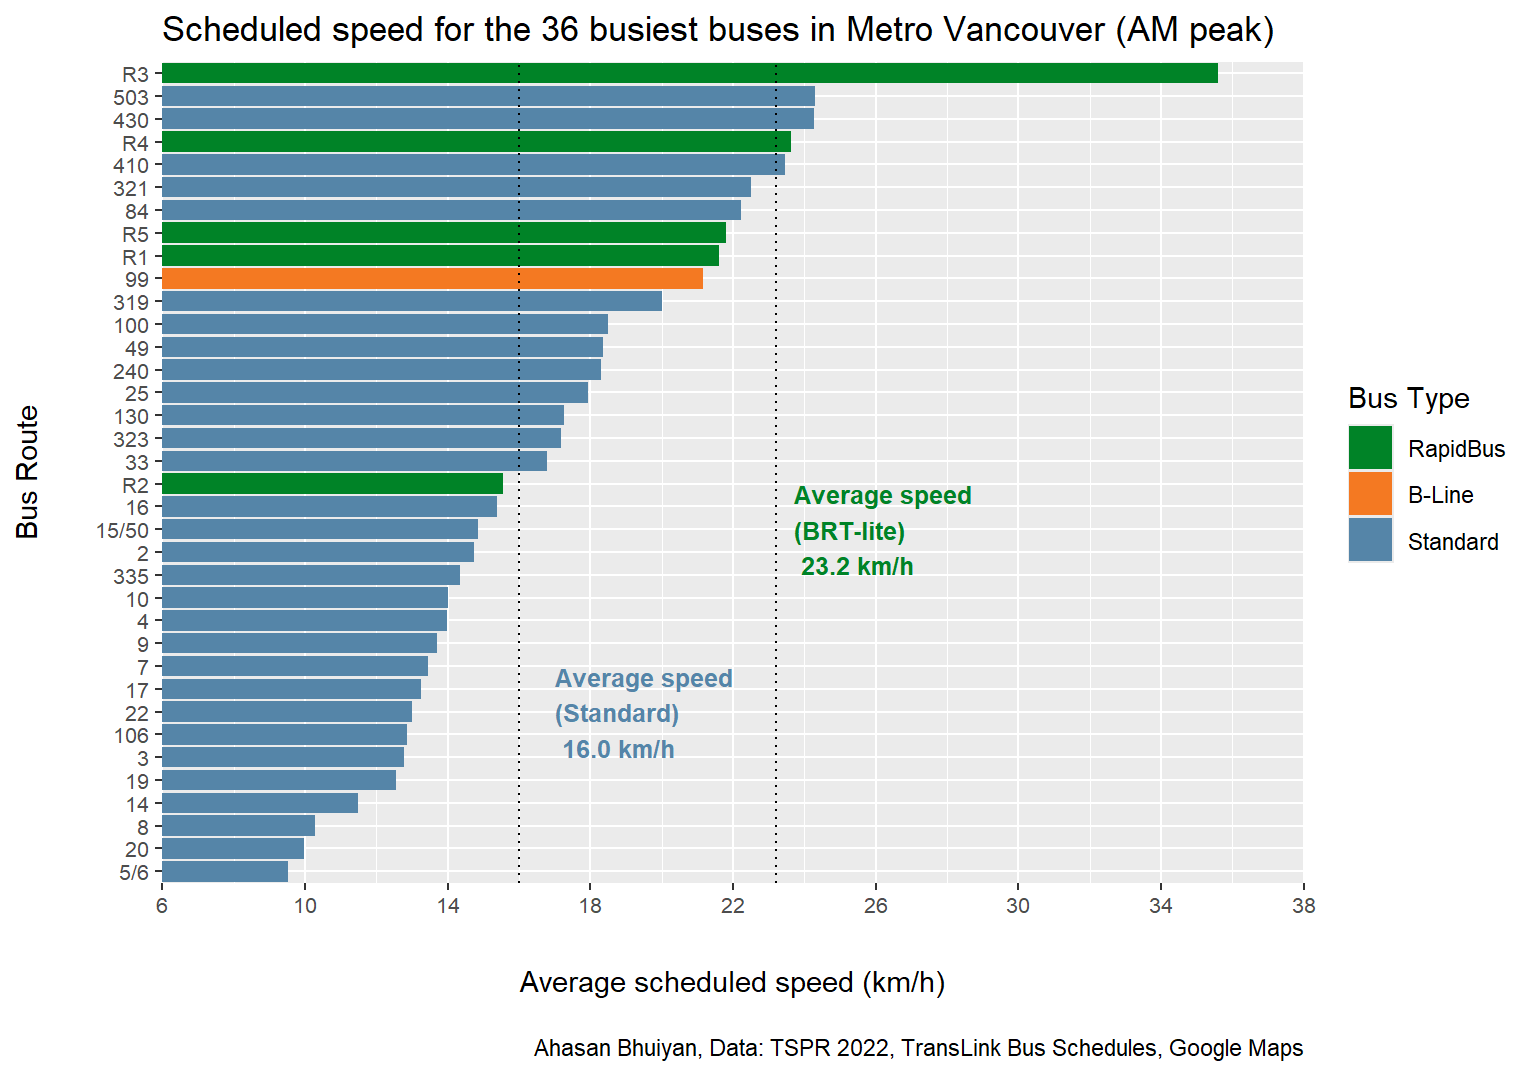
First, let’s take a look at the dataset of buses in Metro Vancouver sorted by average scheduled speed during the AM and PM peaks.
Perhaps unsurprisingly, the BRT-lite routes are among the fastest in the AM peak, with an average scheduled speed that is 45% faster than the typical standard bus. That being said, the standard deviation for the BRT-lite routes is also greater, being 6.65 km/h compared to 4.24 km/h for standard buses. The wider spread in speeds for the BRT-lite buses is illustrated by the R2 and R3 routes. The R2 is considerably slower than other RapidBuses, being the only one to have a sub-20-km/h average scheduled speed. Conversely, the R3 is the fastest RapidBus by a generous margin, being almost 2 standard deviations above the mean BRT-lite speed and more than twice as fast as the R2.
Additionally, there are 5 standard bus routes that are able to achieve similar speeds to the BRT-lite routes, i.e., punching above an average speed of 20 km/h. The cause for this will be explored in the next section.
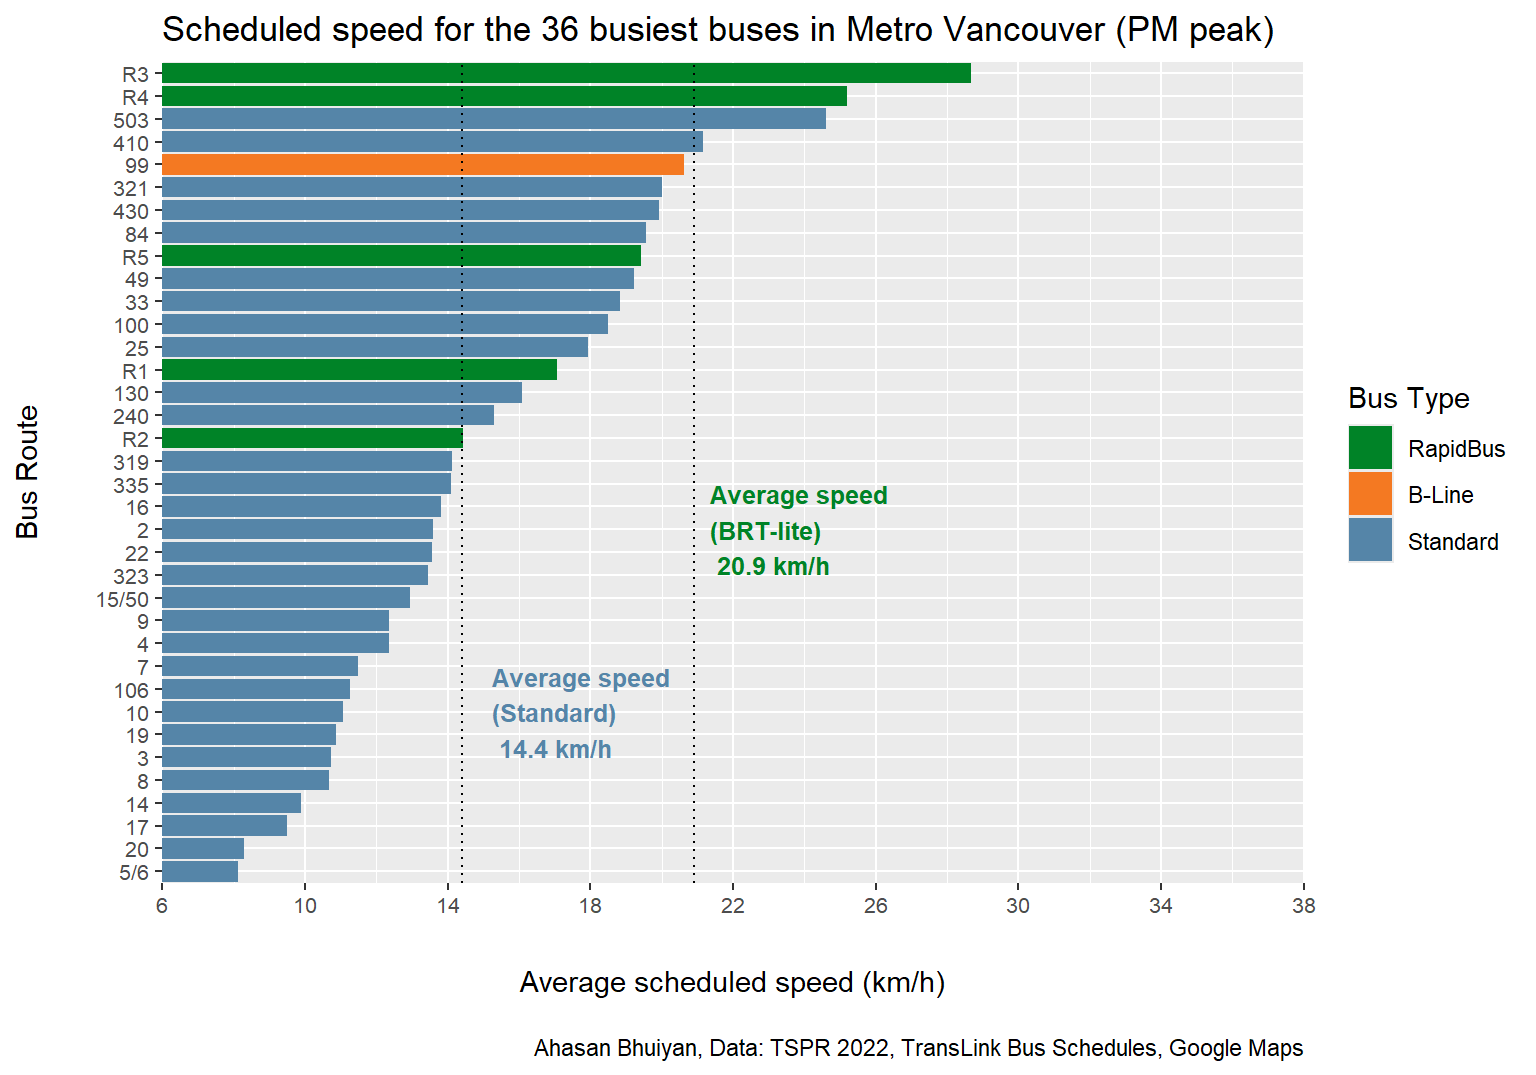
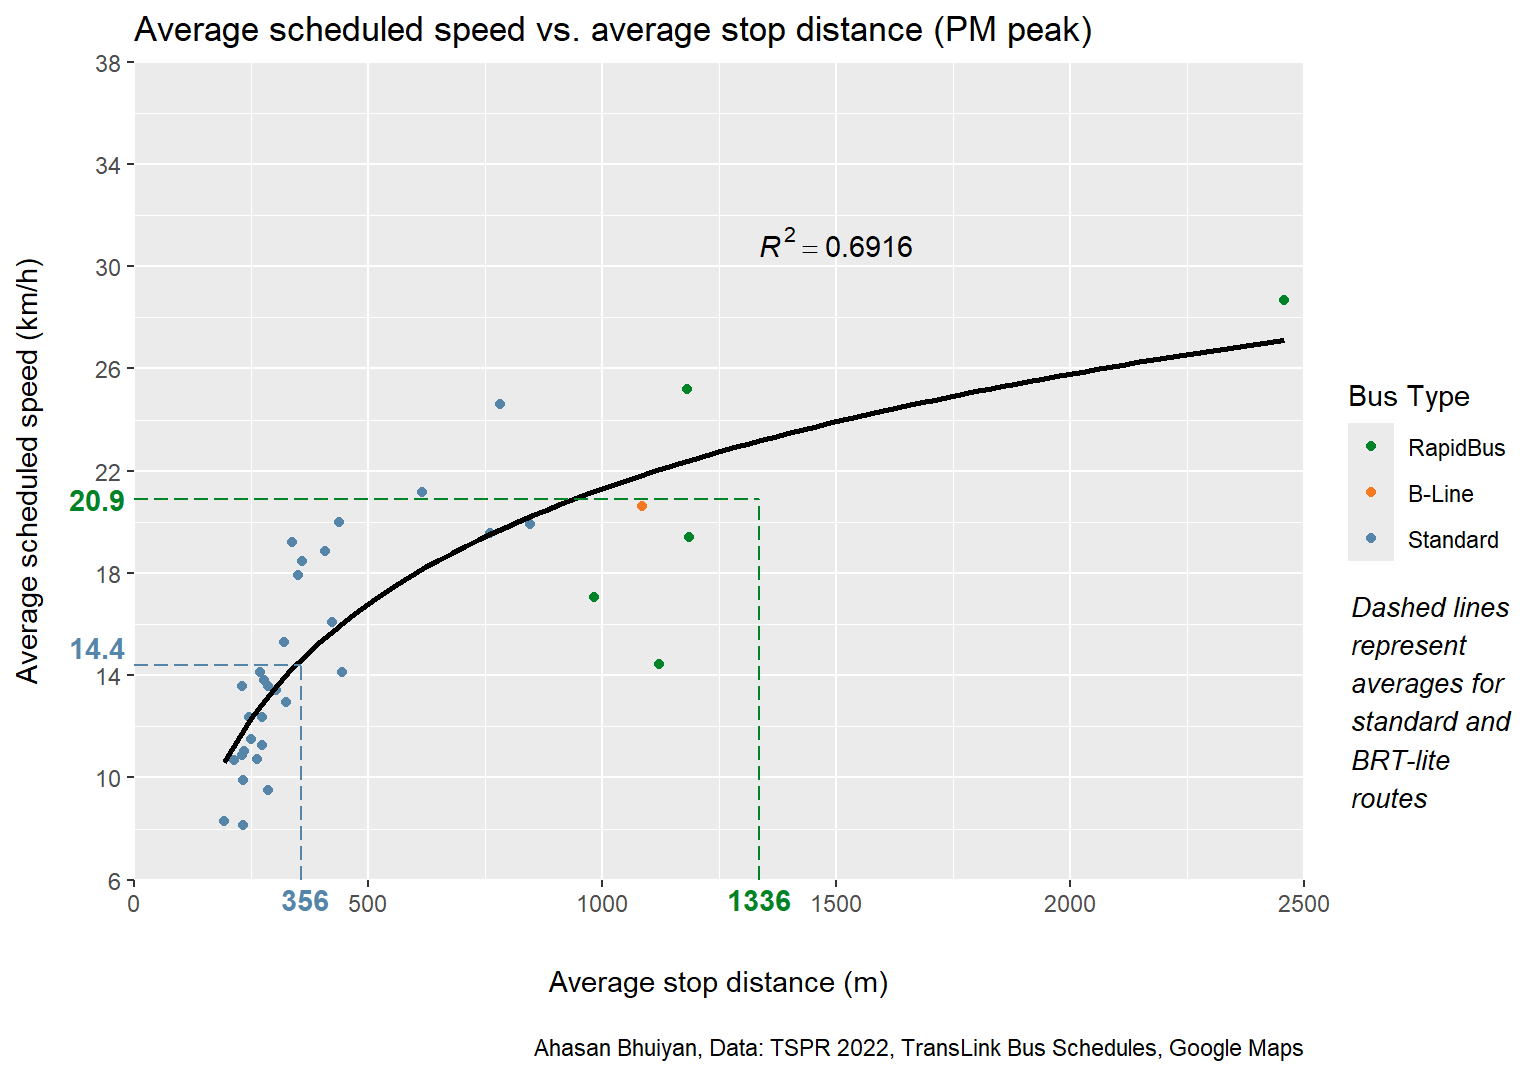
During the PM peak, performances are relatively similar, albeit bus speeds across the board are decreased. Both BRT-lite and standard bus routes are roughly 10% slower during this period. Interestingly, however, the standard deviations for both bus categories are smaller as well, being 5.25 km/h for BRT-lite routes and 4.23 km/h for standard bus routes. This suggests that performances are more consistent during the PM peak, though uniform slowness is hardly a result worth celebrating.
Buses like the 5/6, 20, 17, and 14 suffer particularly badly during the afternoon rush, as their average scheduled speeds drop to below 10 km/h. In regards to BRT-lite routes, while the R1 drops below 20 km/h, it still outperforms the R2, which is again slower than the average standard bus.
Regional Stop Spacing Comparison
Bus speeds vary due to a multiplicity of factors, but key among them is the distance between stops, referred to as stop spacing. For any transit vehicle there is a delay associated with each stop. Time is required to:
- Let the bus slow down to a stop and then accelerate again afterwards
- Let passengers board and alight
- Let the bus driver pull over to the curve, possibly lower the vehicle, and then merge back into traffic
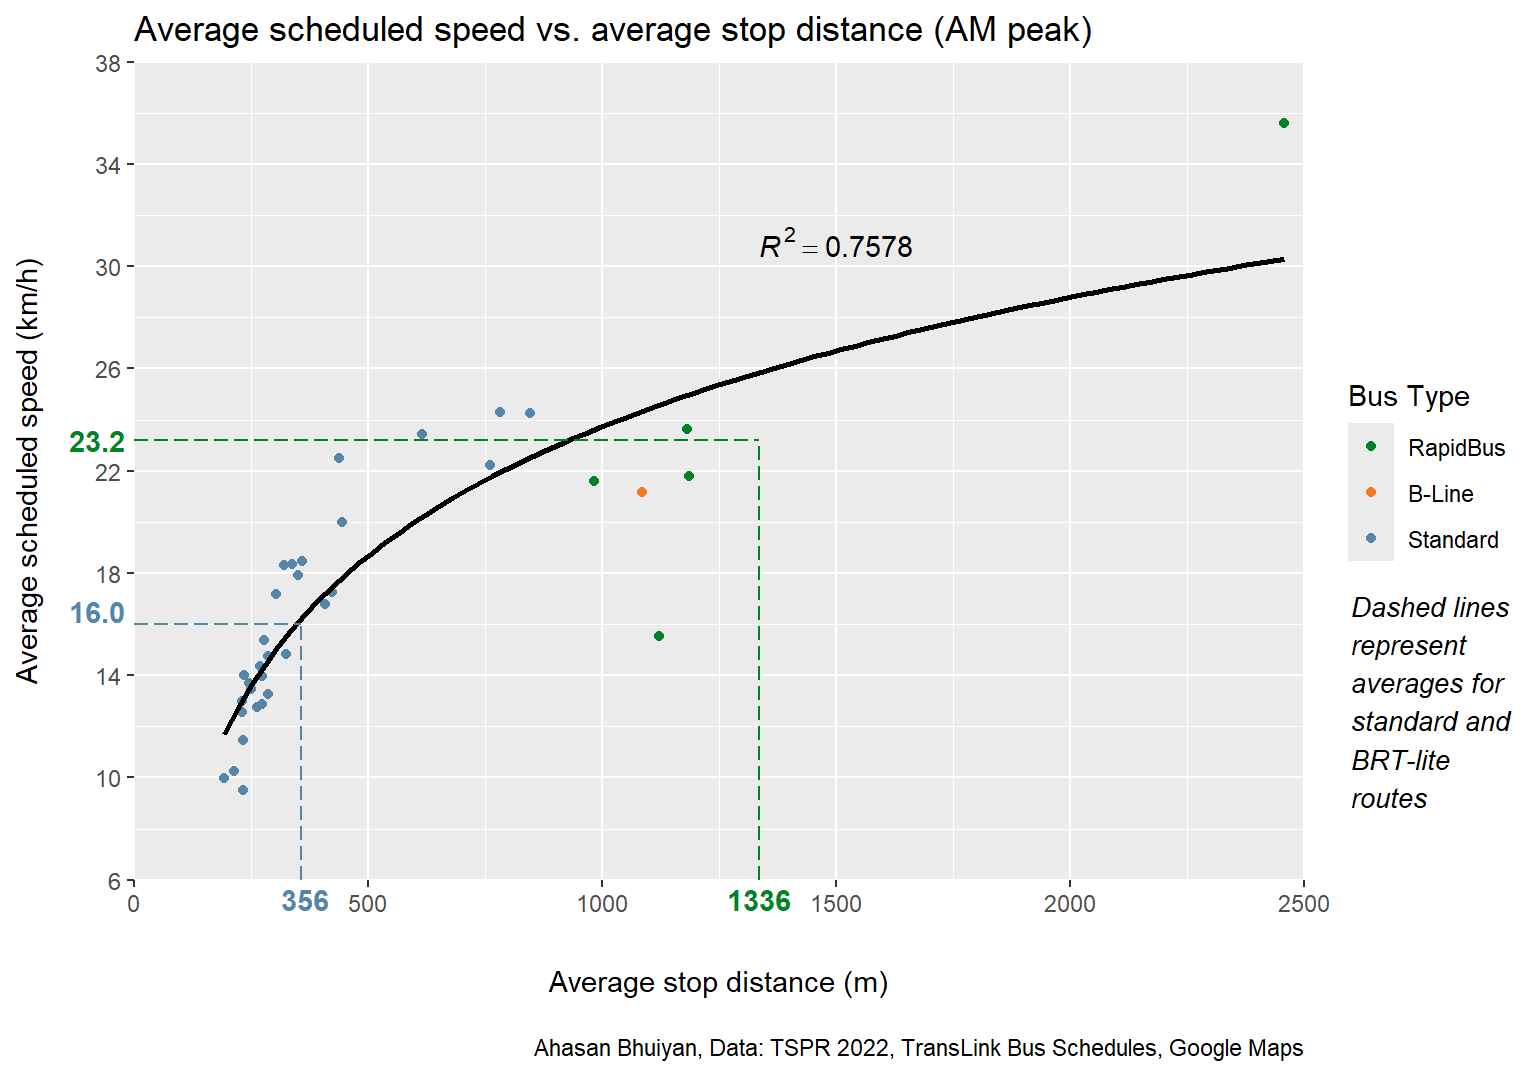
While these time delays may seem insignificant at a single bus stop, they accumulate over the total length of a route.7 Closely packed bus stops on a route result in a bus having to remain stationary for a greater proportion of time, thereby becoming slower on average. This phenomenon is present in the Metro Vancouver dataset as well.
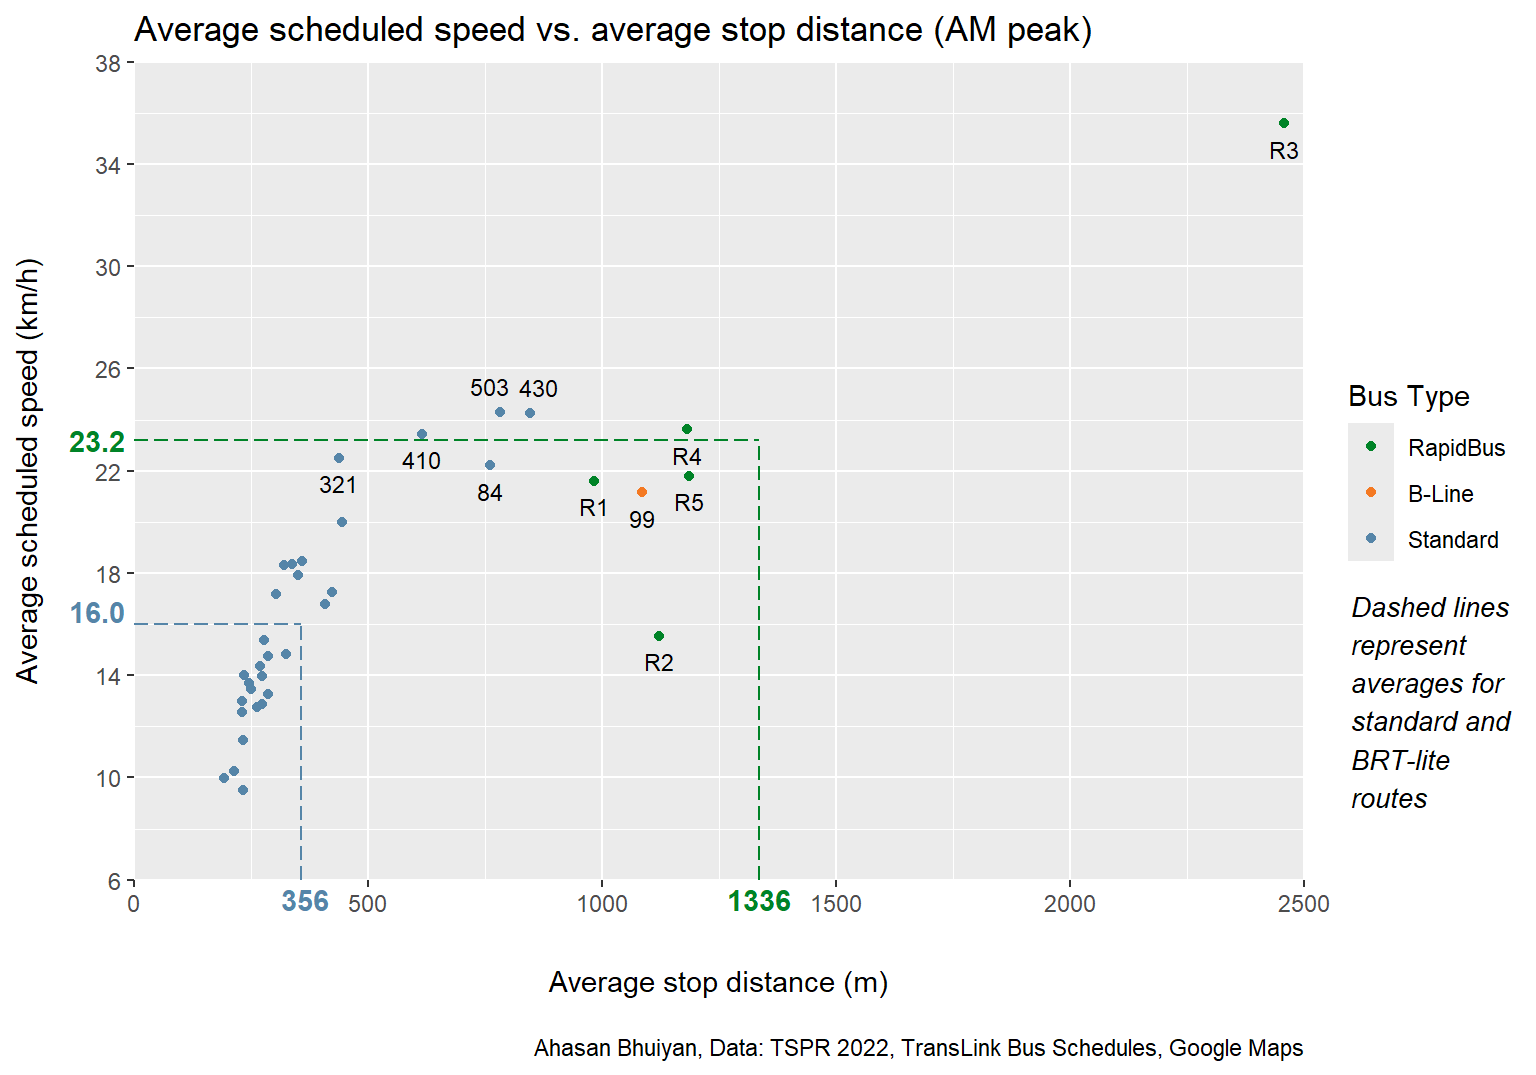
Standard buses have an average distance of 365 m between stops, compared to 1336 m for the BRT-lite buses. While increasing the distance between stops does correspond with faster speeds, BRT-lite levels of stop spacing is not the minimum required to see significant improvements. Case in point, there are 5 standard bus routes that enjoy average speeds in excess of 20 km/h during the AM peak. This feat is possible partially due to their above average stop spacing. The route with the most closely packed stops among them, the 321, still has bus stops spaced out 438 m on average, greater than the 356 m seen on the average standard bus route.
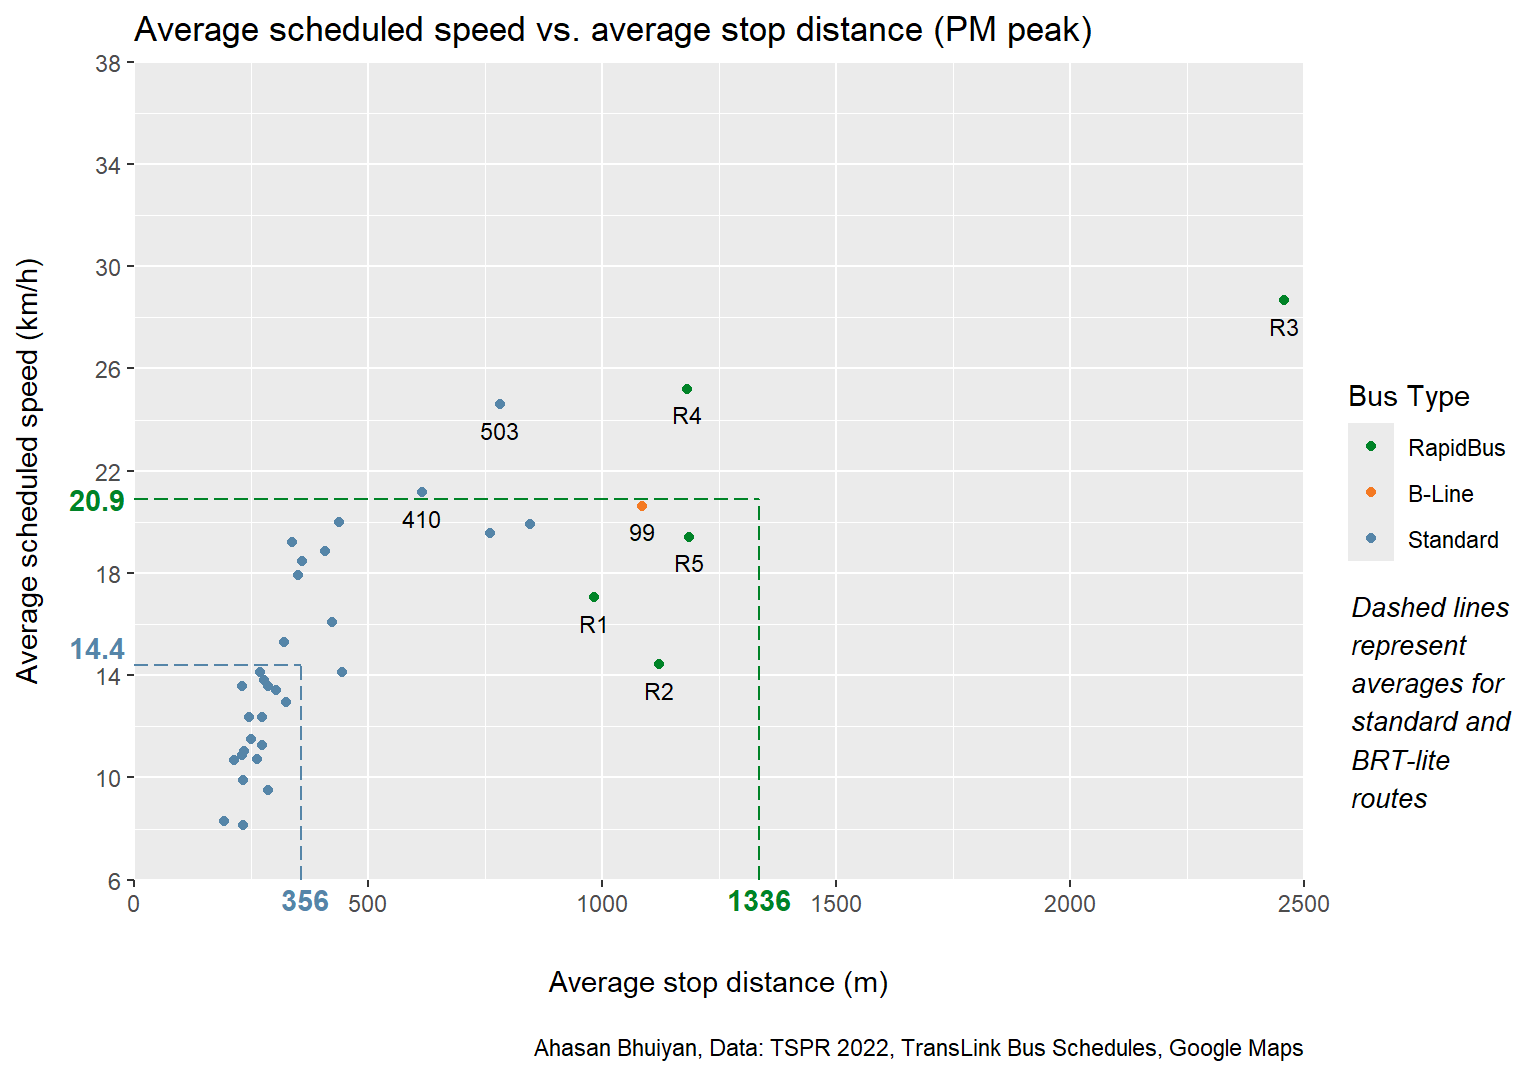
With logarithmic regression, a trend line can be found relating average stop distance with average scheduled speed. The logarithm function was chosen because of its derivative characteristics. A logarithm’s slope starts out very large and then decreases in the direction of increasing input. The same pattern appears in the model, with monumental performance increases obtained for standard buses with only relatively minor increases to stop spacing. Increasing the distance between stops from 200 m to 300 m is likely to bring a greater relative speed boost than going from 300 m to 400 m. Similarly, while the R2 is the fastest BRT-lite route, its 2457 m stop spacing is a result of its location along a highway. Such extremely wide stop spacing is neither applicable to most conventional urban routes, nor is it a necessary threshold for better bus performance.
The benefits of stop spacing increases is not lost on TransLink, as their Bus Stop Balancing program has been active in the last few years, consolidating and relocating bus stops on a number of routes mentioned. Based on their Transit Service Guidelines, TransLink aims to have a stop spacing regimen of 300 to 800 m for routes classified as all-day frequent.8
Astute readers will note that while most bus routes appear to fit the logarithmic model decently well, one notable exception is once again the R2 RapidBus, whose speed is far below what is theoretically possible with its wide stop spacing. This returns to the multifaceted nature of bus performance and how stop spacing alone cannot fully predict speeds. Buses benefit from transit priority measures like bus lanes. Although the mere existence of bus lanes does not necessarily mean better performance9, effective implementation can speed up public transit. The R2 was recently the beneficiary of a project designed to better integrate transit priority on the North Shore by adding bus lanes to a missing segment of the R2’s route10, which will hopefully reduce delays and close the gap between current performance and that forecasted by the model.
Multinational Stop Spacing Comparison
To see how Metro Vancouver compares with other metropolitan areas in regards to stop spacing and transit speeds, data from Marco Chitti’s original post11 is borrowed and added to. The set of cities includes the Canadian metropolises of Montréal and Toronto along with international counterparts from Europe. Focus is placed on standard bus performance during the AM peak. so the RapidBus and B-Line routes are excluded.
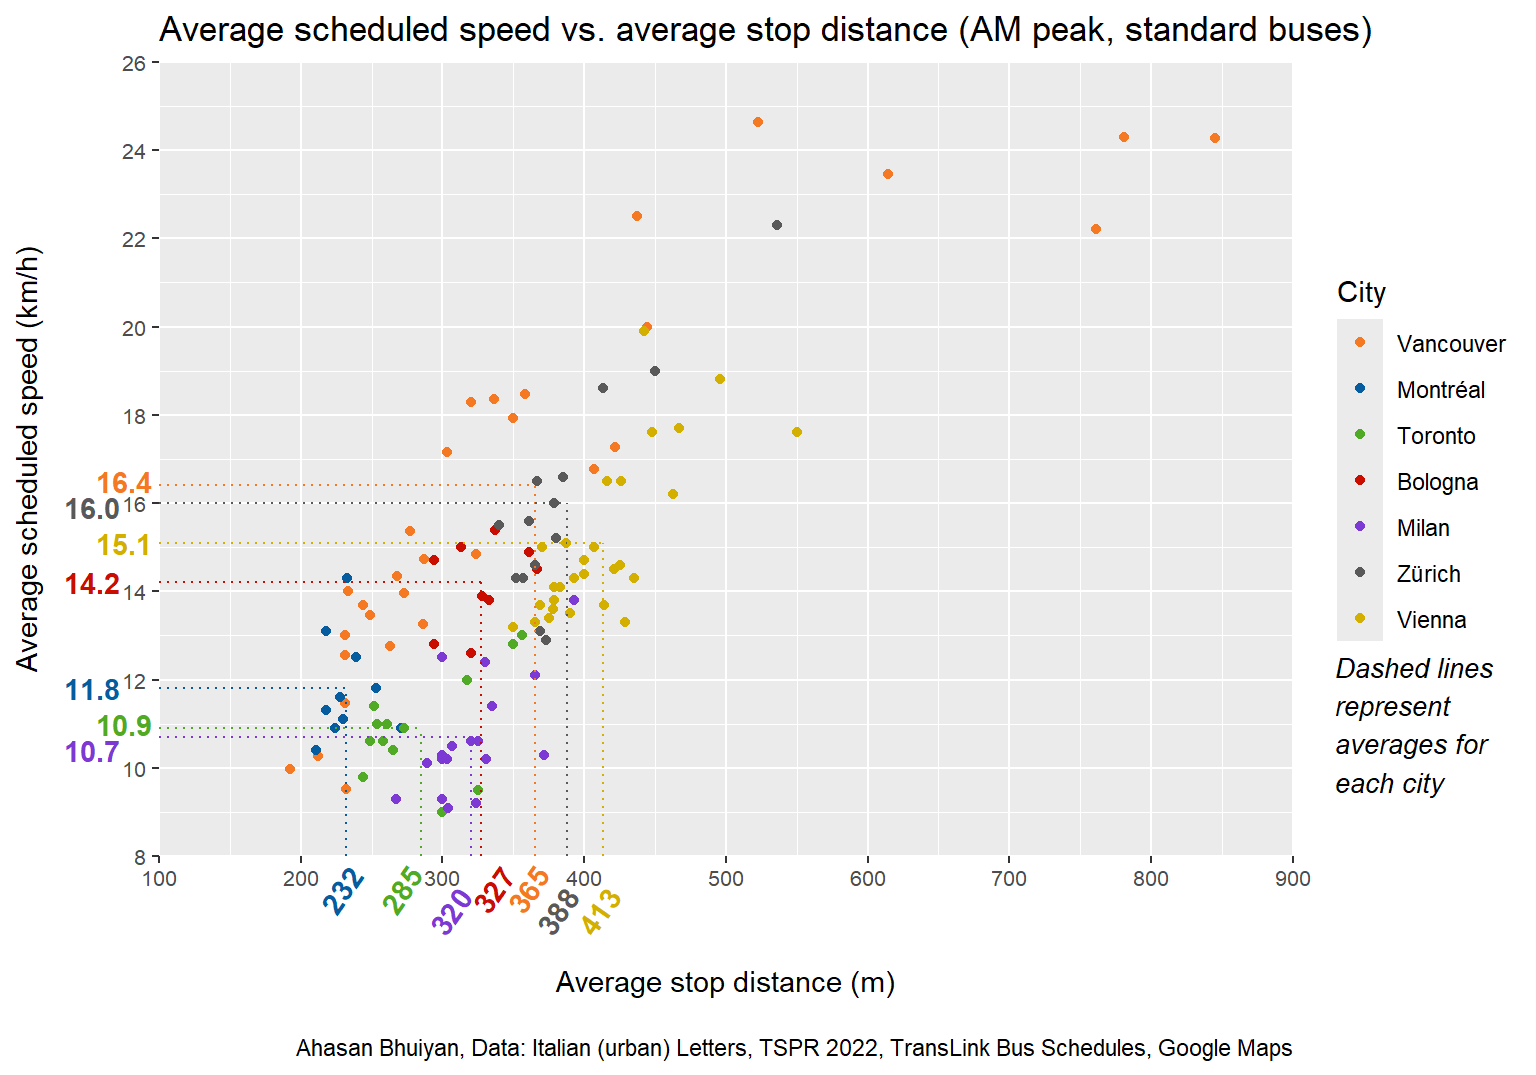
It becomes apparent that Montréal and Toronto have the smallest average stop spacing and consequently some of the slowest standard buses. Meanwhile, Milan has larger stop spacing values, but suffers from the lack of other transit priority elements, ending up with a slower speed.12 Metro Vancouver’s stop spacing is more in line with that found in the European cities.
While Metro Vancouver wins out on average speed for its standard buses in this comparison, the exact speed rankings should be taken with a grain of salt given the limited sample size of bus routes. Moreover, as hinted with Milan, there’s more to bus network performance than just stop spacing, and Metro Vancouver should look at other factors as well as it continues to upgrade its transit system.
BRT-Lite Time Savings Comparison
As mentioned previously, when compared to the 30 busiest standard buses, the BRT-lite buses are scheduled to be on average 41% faster during the AM peak. However, such comparisons can also be done on a corridor-by-corridor basis, contrasting each BRT-lite bus with its local alternative during the section of shared travel.
Not all the BRT-lite routes have local counterparts applicable for an apples-to-apples comparison. The R1 doesn’t have a local equivalent that serves both the King George Boulevard and 104 St. Meanwhile, the R2’s local sibling, the 255, shares the same route only for a short 3-4 km, where the benefits of a “rapid” route would not be as pronounced. As such, only the 99 B-Line, R3, R4, and R5 were selected for comparison as they have shared sections of at least 5 km. As it is clear that the BRT-lite routes possess an average speed advance, the focus is shifted onto the time savings afforded by the BRT-lite routes. The results are as follows for the AM peak.
| AM Peak | |||||||
| Bus route | From | To | Shared section (m) | Scheduled running time (mins) | BRT-lite time savings | ||
| Local | BRT-lite | Local | BRT-lite | ||||
| 9 | 99 B-Line | Commercial-Broadway Station | UBC | 14100 | 49 | 40 | 18% (9 mins) |
| 701 | R3 | Haney Place | Coquitlam Central Station | 17200 | 48 | 29 | 40% (19 mins) |
| 41 | R4 | Joyce-Collingwood Station | Dunbar Loop | 11500 | 43 | 28 | 35% (15 mins) |
| 14 | R5 | Kootenay Loop | Hastings St @ Richards St (local) / Granville St (BRT-lite) | 6410 | 28 | 20 | 29% (8 mins) |
The success of the RapidBus implementations is evident through the large relative time savings associated with the R3, R4, and R5 routes as compared to the legacy 99 B-Line. For completeness, the PM peak time savings are also listed below.
| PM Peak | |||||||
| Bus route | From | To | Shared section (m) | Scheduled running time (mins) | BRT-lite time savings | ||
| Local | BRT-lite | Local | BRT-lite | ||||
| 9 | 99 B-Line | Commercial-Broadway Station | UBC | 14100 | 52 | 41 | 21% (11 mins) |
| 701 | R3 | Haney Place | Coquitlam Central Station | 17200 | 51 | 36 | 29% (15 mins) |
| 41 | R4 | Joyce-Collingwood Station | Dunbar Loop | 11500 | 42 | 26 | 38% (16 mins) |
| 14 | R5 | Kootenay Loop | Hastings St @ Richards St (local) / Granville St (BRT-lite) | 6410 | 29 | 24 | 17% (5 mins) |
Other Contributing Factors
While the focus thus far has primarily been on stop spacing within Metro Vancouver’s bus network and its relation to average scheduled speeds, several other elements play a role in the transit speed equation. Both Chitti and TransLink point out bus bulbs and all-door boarding as bus priority measures worth considering to reduce dwell times.13 14 The greater speeds attributed to BRT-lite routes in this dataset is in part due to those features. It’s important to note that municipalities have the jurisdiction to enact these infrastructure changes with little required oversight, should they have the political will to do so.15
Chitti goes further and points out that not all bus lanes are created equally. Ineffective implementations will not result in greater speeds. Lack of transit signal priority, lack of bus lane enforcement, excessive numbers of controlled intersections, and shared bus lane/right turn lanes can all be impediments to functional bus lanes.16 For a more in-depth look at how bus lanes can be successfully integrated with other transit priority elements, readers are encouraged to explore Chitti’s original work as he describes Bologna’s layered approach.
Conclusion
At the time of writing, the latest RapidBus route, the R6, is nearing completion at a projected cost of $33 million CAD17. BRT-lite routes play a key role in providing speed and capacity on important corridors throughout the region, but it is impossible to introduce RapidBuses on every Metro Vancouver bus route without a bottomless wallet. Yet as shown in the data exploration, it is not necessary to have a BRT-lite route with BRT-lite levels of infrastructure expenditure to achieve faster speeds. Careful and deliberate planning can greatly improve the performance of standard buses on routes with smaller ridership, with a key step being the consolidation of bus stops. The logarithmic nature of stop spacing means that large returns on investment (increased speed, reduced operating expenditures, greater ridership potential18 19) can be achieved with only marginal increases to average stop distance. No longer destined to be slow forever, improved standard bus routes can usher in a new era of mixed-traffic public transit, reaching far beyond the geographical limits of BRT-lite routes.
Acknowledgements
This look at bus speeds and stop spacing was largely inspired by Marco Chitti’s excellent Substack post comparing bus performances in Montréal and Bologna, as evident by the number of times I’ve referenced it. I wanted to extend Chitti’s analysis to Metro Vancouver, building off the data he already collected.
Additional inspiration came from Jens von Bergmann’s blog posts at Mountain Doodles, where he uses data to answer intriguing questions about transportation and housing in the region. My interest in using R for making plots was influenced by the many insightful examples Jens has published online.
Appendix A: Map of FTN Bus Speeds in the City of Vancouver
While working on this analysis into bus speeds, I was also learning how to use GIS software. As such, I combined the two ventures to a create a map of scheduled bus speeds inside the City of Vancouver. Specifically, I mapped bus routes from the Frequent Transit Network, a collection of routes that run at least every 15 minutes for most of the day, during the AM peak.
As seen in the figure below, the slowest routes tend to be north-south routes along with those within Downtown Vancouver. These routes also tend to have the smallest stop spacing.

Appendix B: Metro Vancouver Bus Speed Data
The data used for this analysis can be found here. Like Chitti’s original data, readers are welcome to borrow and improve upon my results.
Footnotes
https://view.publitas.com/translink/bus-speed-and-reliability-report-2023↩︎
https://www.translink.ca/schedules-and-maps/rapidbus↩︎
https://www.translink.ca/-/media/translink/documents/plans-and-projects/rapid-transit/bus-rapid-transit/brt-attributes-for-metro-vancouver.pdf↩︎
https://www.translink.ca/plans-and-projects/strategies-plans-and-guidelines/managing-the-transit-network#2022-transit-service-performance-review↩︎
https://www.translink.ca/schedules-and-maps/bus-schedule↩︎
https://public.tableau.com/app/profile/translink/viz/2022TSPR-BusSeaBusSummaries/TheWorkbook↩︎
https://www.youtube.com/watch?v=AgKw0bvvgZ4↩︎
https://www.translink.ca/plans-and-projects/projects/bus-projects/bus-stop-balancing↩︎
https://marcochitti.substack.com/p/getting-bus-priority-right-lessons↩︎
https://www.cnv.org/streets-transportation/transportation-projects/past-projects/marine-main-r2-rapidbus-upgrades↩︎
See footnote 9↩︎
See footnote 9↩︎
See footnote 9↩︎
See footnote 1↩︎
See footnote 1↩︎
See footnote 9↩︎
https://www.translink.ca/plans-and-projects/projects/bus-projects/r6-scott-road-rapidbus↩︎
See footnote 9↩︎
See footnote 1↩︎